Low-Overhead Data Collection
Collect data with minimal overhead. WorkVisualizer supports both pre and post-processing capabilities.
WorkVisualizer helps you quickly uncover inefficiencies in parallel codes by combining intelligent analysis with powerful, interactive visualizations.
Collect. Analyze. Visualize. Purpose-built for large-scale parallel applications.
Collect data with minimal overhead. WorkVisualizer supports both pre and post-processing capabilities.
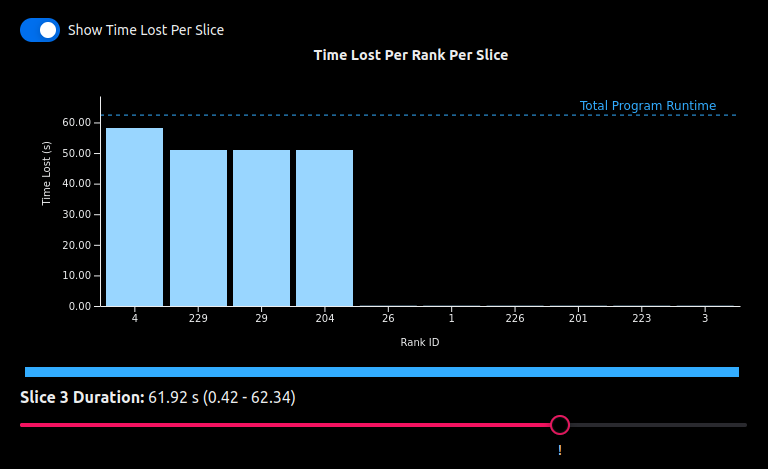
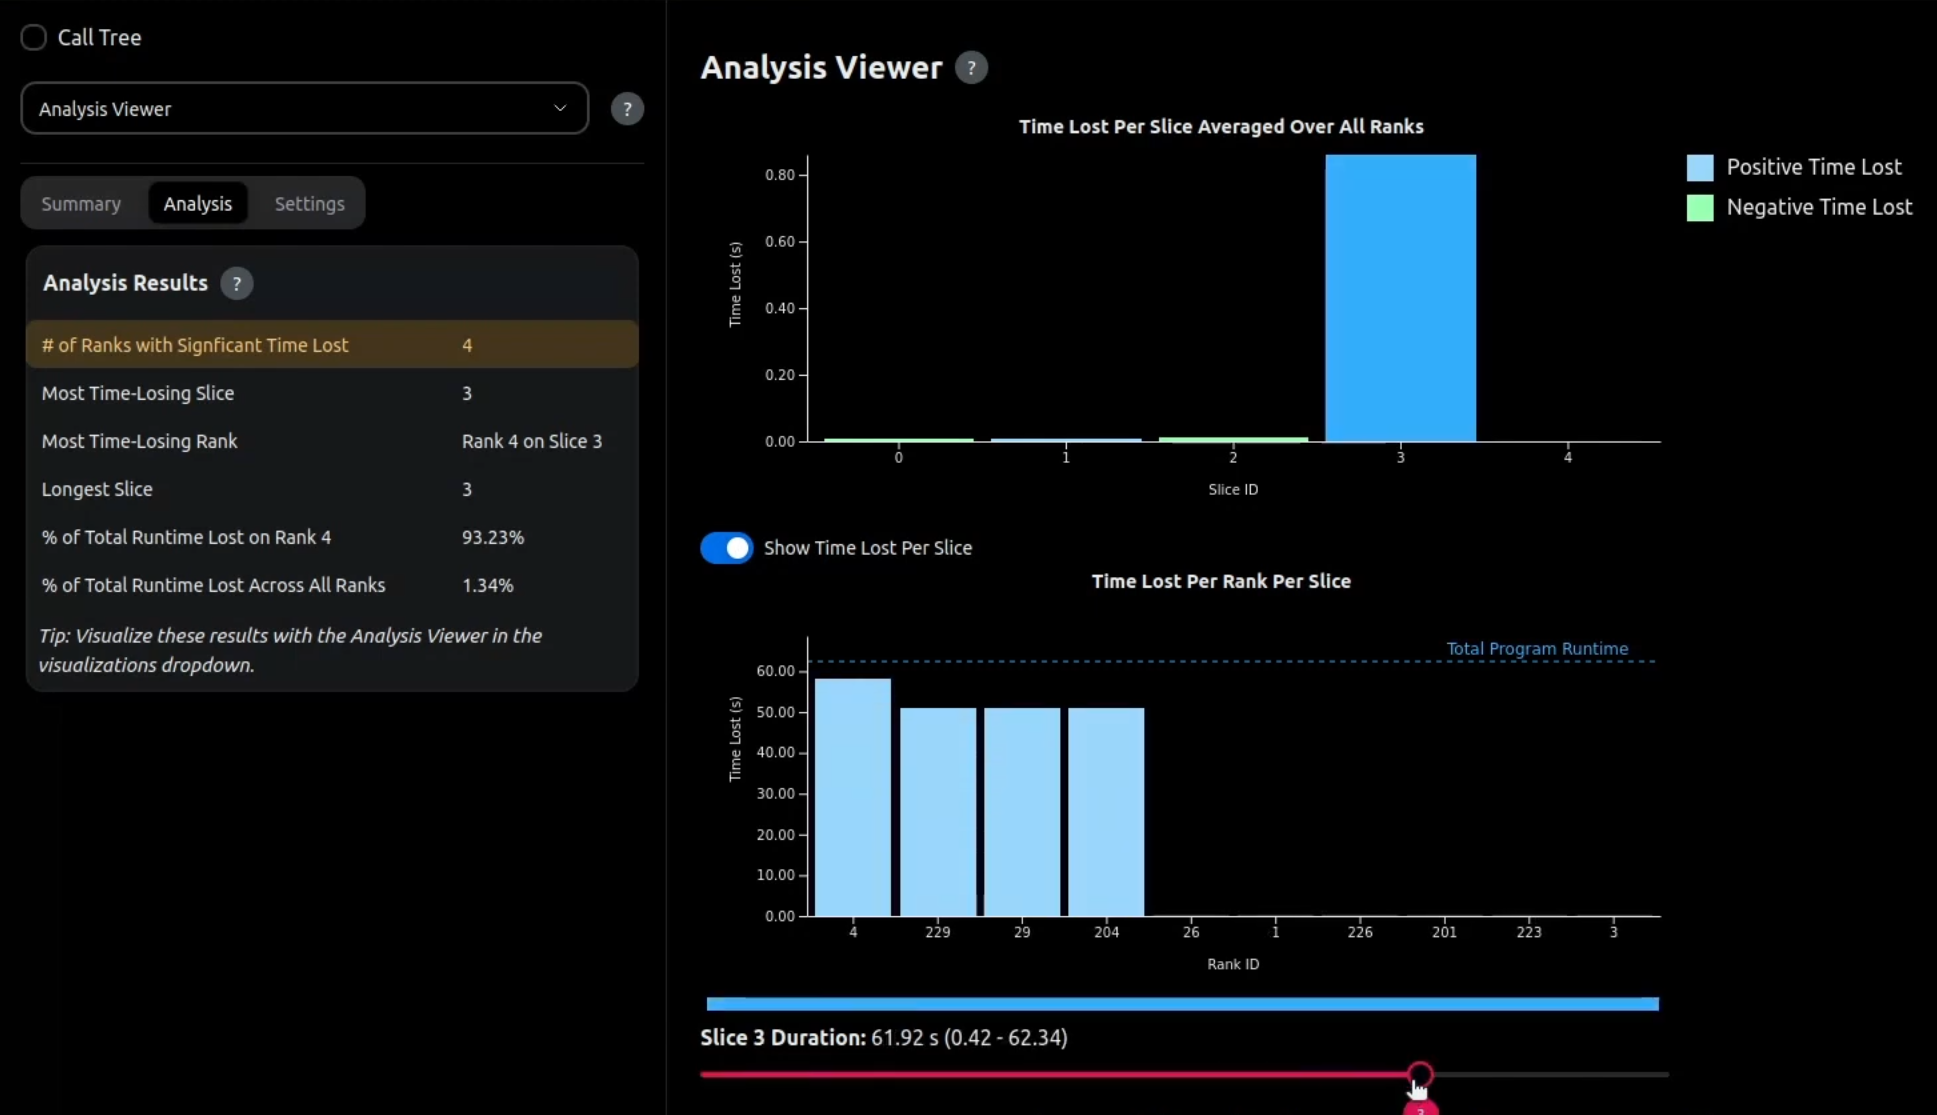
Analyze your application's execution using our advanced machine learning algorithms. Understand stalls, imbalance, communication issues, and receive targeted optimization suggestions.
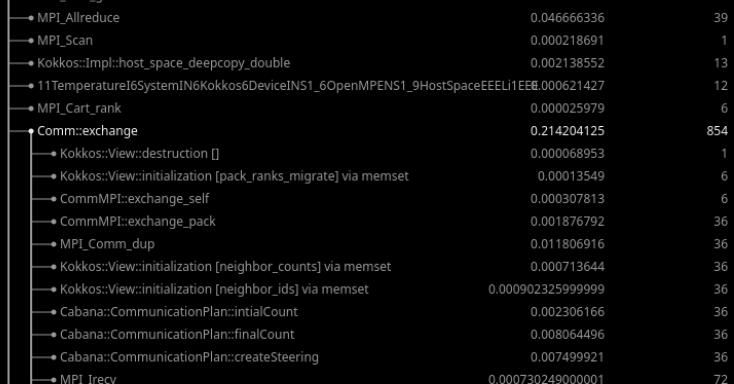
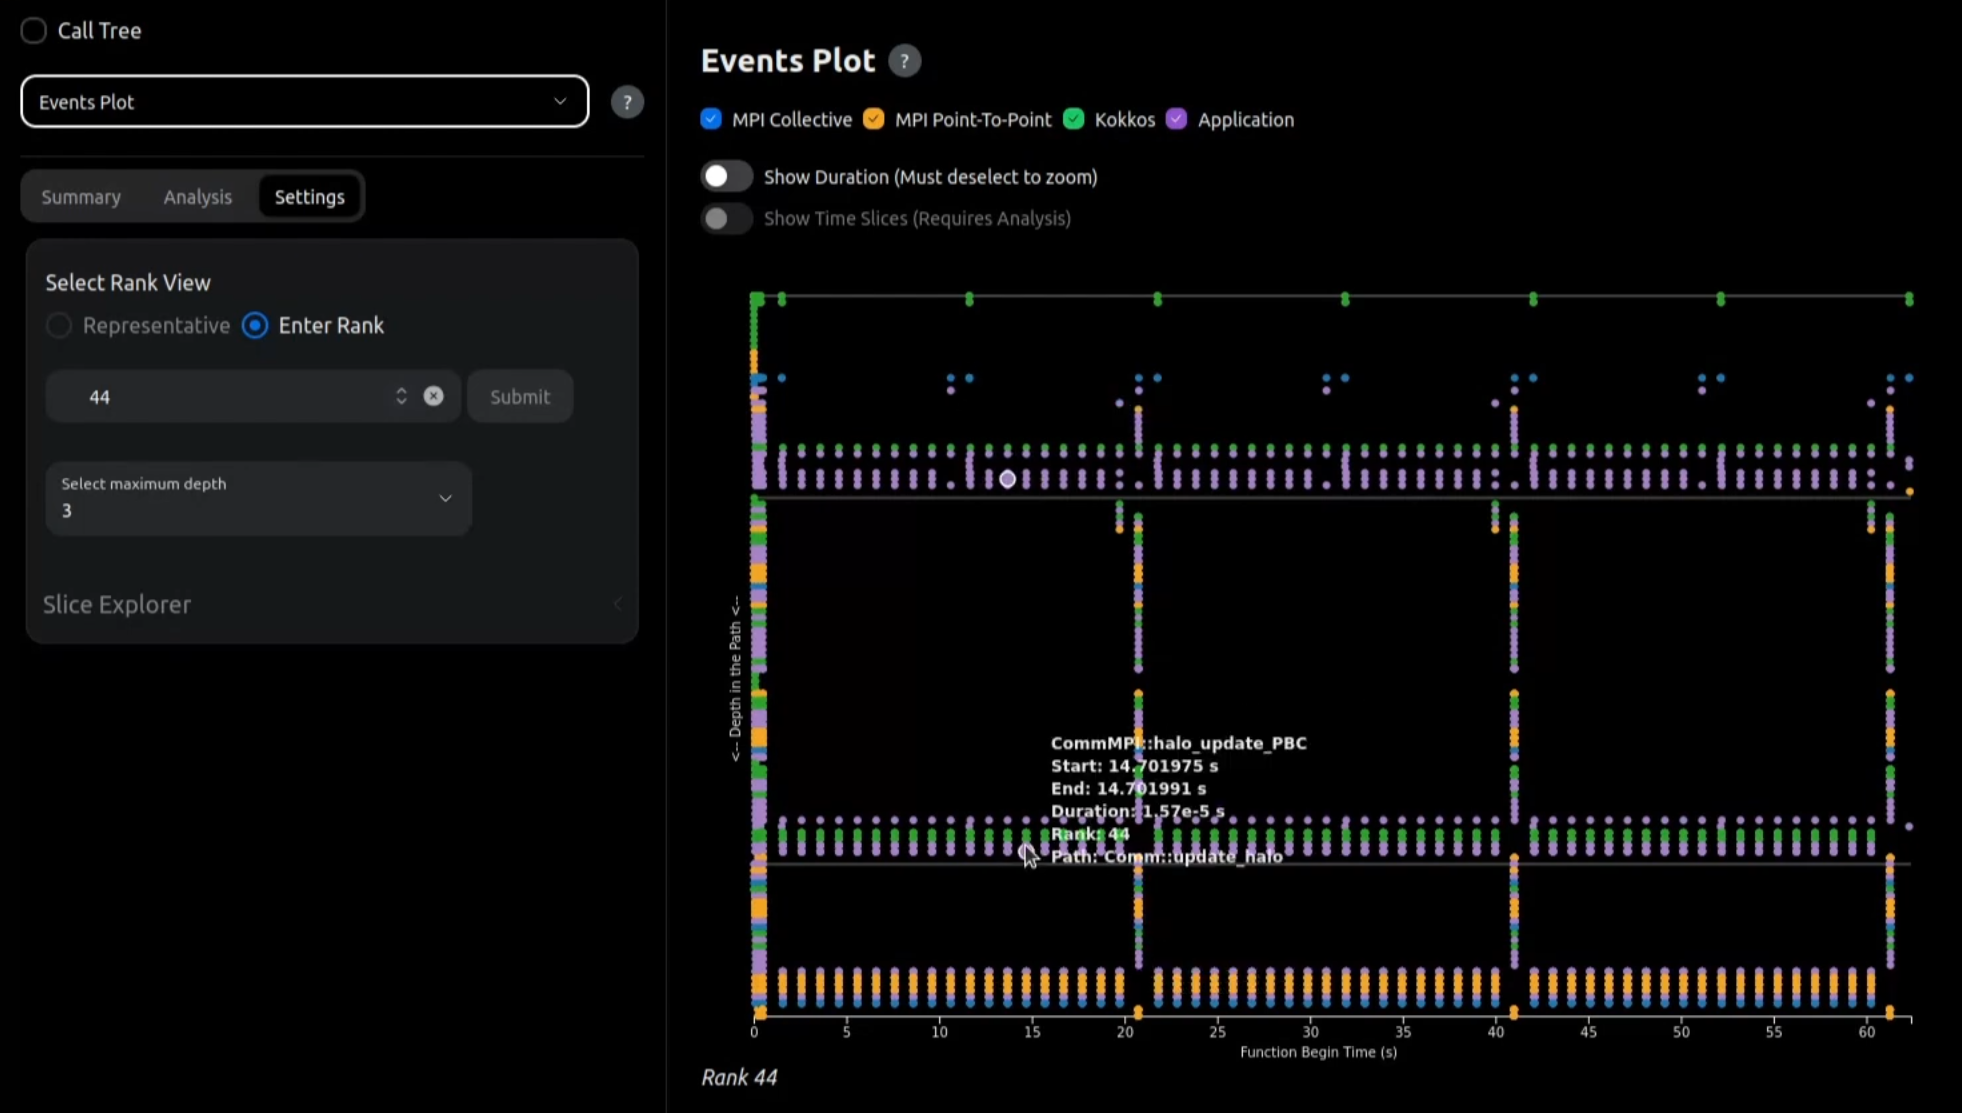
Visualize massive profiling datasets from large-scale parallel applications. Navigate timelines, drill down function calls, explore node heatmaps, and more, designed specifically for HPC.
From research groups to production supercomputers.
Replace multiple vendor-specific profilers with a single, unified workflow. Cut licensing and training overhead while standardizing how teams analyze performance.
Reduce optimization cycles and accelerate projects on new technologies. Lower the entry barrier so small and mid-sized teams can confidently benefit from HPC sooner.
Improve resource utilization to cut compute time, queue churn, and idle cycles. Deliver measurable energy and cost savings at scale.
We'll email important development updates, release dates, and early-access opportunities.
The WorkVisualizer 1.0.0-alpha was supported by the U.S. Department of Energy, Office of Science, Office of Advanced Scientific Computing Research through the Small Business Innovation Research (SBIR) Program, under SBIR Phase I Award DE-SC-0024832.